Monona, Iowa We are giving away $1200 in prizes - enter simply by sending us your own city pictures!
OSM Map
General Map
Google Map
MSN Map
OSM Map
General Map
Google Map
MSN Map
OSM Map
General Map
Google Map
MSN Map
OSM Map
General Map
Google Map
MSN Map
Please wait while loading the map...
Population in 2014: 1,510 (0% urban, 100% rural). Population change since 2000: -2.6%Males: 733 Females: 777
Business Search - 14 Million verified businesses
Data:
Median household income ($)
Median household income (% change since 2000)
Household income diversity
Ratio of average income to average house value (%)
Ratio of average income to average rent
Median household income ($) - White
Median household income ($) - Black or African American
Median household income ($) - Asian
Median household income ($) - Hispanic or Latino
Median household income ($) - American Indian and Alaska Native
Median household income ($) - Multirace
Median household income ($) - Other Race
Median household income for houses/condos with a mortgage ($)
Median household income for apartments without a mortgage ($)
Races - White alone (%)
Races - White alone (% change since 2000)
Races - Black alone (%)
Races - Black alone (% change since 2000)
Races - American Indian alone (%)
Races - American Indian alone (% change since 2000)
Races - Asian alone (%)
Races - Asian alone (% change since 2000)
Races - Hispanic (%)
Races - Hispanic (% change since 2000)
Races - Native Hawaiian and Other Pacific Islander alone (%)
Races - Native Hawaiian and Other Pacific Islander alone (% change since 2000)
Races - Two or more races (%)
Races - Two or more races (% change since 2000)
Races - Other race alone (%)
Races - Other race alone (% change since 2000)
Racial diversity
Unemployment (%)
Unemployment (% change since 2000)
Unemployment (%) - White
Unemployment (%) - Black or African American
Unemployment (%) - Asian
Unemployment (%) - Hispanic or Latino
Unemployment (%) - American Indian and Alaska Native
Unemployment (%) - Multirace
Unemployment (%) - Other Race
Population density (people per square mile)
Population - Males (%)
Population - Females (%)
Population - Males (%) - White
Population - Males (%) - Black or African American
Population - Males (%) - Asian
Population - Males (%) - Hispanic or Latino
Population - Males (%) - American Indian and Alaska Native
Population - Males (%) - Multirace
Population - Males (%) - Other Race
Population - Females (%) - White
Population - Females (%) - Black or African American
Population - Females (%) - Asian
Population - Females (%) - Hispanic or Latino
Population - Females (%) - American Indian and Alaska Native
Population - Females (%) - Multirace
Population - Females (%) - Other Race
Likely homosexual households (%)
Likely homosexual households (% change since 2000)
Likely homosexual households - Lesbian couples (%)
Likely homosexual households - Lesbian couples (% change since 2000)
Likely homosexual households - Gay men (%)
Likely homosexual households - Gay men (% change since 2000)
Cost of living index
Median gross rent ($)
Median contract rent ($)
Median monthly housing costs ($)
Median house or condo value ($)
Median house or condo value ($ change since 2000)
Mean house or condo value by units in structure - 1, detached ($)
Mean house or condo value by units in structure - 1, attached ($)
Mean house or condo value by units in structure - 2 ($)
Mean house or condo value by units in structure by units in structure - 3 or 4 ($)
Mean house or condo value by units in structure - 5 or more ($)
Mean house or condo value by units in structure - Boat, RV, van, etc. ($)
Mean house or condo value by units in structure - Mobile home ($)
Median house or condo value ($) - White
Median house or condo value ($) - Black or African American
Median house or condo value ($) - Asian
Median house or condo value ($) - Hispanic or Latino
Median house or condo value ($) - American Indian and Alaska Native
Median house or condo value ($) - Multirace
Median house or condo value ($) - Other Race
Median resident age
Resident age diversity
Median resident age - Males
Median resident age - Females
Median resident age - White
Median resident age - Black or African American
Median resident age - Asian
Median resident age - Hispanic or Latino
Median resident age - American Indian and Alaska Native
Median resident age - Multirace
Median resident age - Other Race
Median resident age - Males - White
Median resident age - Males - Black or African American
Median resident age - Males - Asian
Median resident age - Males - Hispanic or Latino
Median resident age - Males - American Indian and Alaska Native
Median resident age - Males - Multirace
Median resident age - Males - Other Race
Median resident age - Females - White
Median resident age - Females - Black or African American
Median resident age - Females - Asian
Median resident age - Females - Hispanic or Latino
Median resident age - Females - American Indian and Alaska Native
Median resident age - Females - Multirace
Median resident age - Females - Other Race
Commute - mean travel time to work (minutes)
Travel time to work - Less than 5 minutes (%)
Travel time to work - Less than 5 minutes (% change since 2000)
Travel time to work - 5 to 9 minutes (%)
Travel time to work - 5 to 9 minutes (% change since 2000)
Travel time to work - 10 to 19 minutes (%)
Travel time to work - 10 to 19 minutes (% change since 2000)
Travel time to work - 20 to 29 minutes (%)
Travel time to work - 20 to 29 minutes (% change since 2000)
Travel time to work - 30 to 39 minutes (%)
Travel time to work - 30 to 39 minutes (% change since 2000)
Travel time to work - 40 to 59 minutes (%)
Travel time to work - 40 to 59 minutes (% change since 2000)
Travel time to work - 60 to 89 minutes (%)
Travel time to work - 60 to 89 minutes (% change since 2000)
Travel time to work - 90 or more minutes (%)
Travel time to work - 90 or more minutes (% change since 2000)
Marital status - Never married (%)
Marital status - Now married (%)
Marital status - Separated (%)
Marital status - Widowed (%)
Marital status - Divorced (%)
Median family income ($)
Median family income (% change since 2000)
Median non-family income ($)
Median non-family income (% change since 2000)
Median per capita income ($)
Median per capita income (% change since 2000)
Median family income ($) - White
Median family income ($) - Black or African American
Median family income ($) - Asian
Median family income ($) - Hispanic or Latino
Median family income ($) - American Indian and Alaska Native
Median family income ($) - Multirace
Median family income ($) - Other Race
Median year house/condo built
Median year apartment built
Year house built - Built 2005 or later (%)
Year house built - Built 2000 to 2004 (%)
Year house built - Built 1990 to 1999 (%)
Year house built - Built 1980 to 1989 (%)
Year house built - Built 1970 to 1979 (%)
Year house built - Built 1960 to 1969 (%)
Year house built - Built 1950 to 1959 (%)
Year house built - Built 1940 to 1949 (%)
Year house built - Built 1939 or earlier (%)
Average household size
Household density (households per square mile)
Average household size - White
Average household size - Black or African American
Average household size - Asian
Average household size - Hispanic or Latino
Average household size - American Indian and Alaska Native
Average household size - Multirace
Average household size - Other Race
Occupied housing units (%)
Vacant housing units (%)
Owner occupied housing units (%)
Renter occupied housing units (%)
Vacancy status - For rent (%)
Vacancy status - For sale only (%)
Vacancy status - Rented or sold, not occupied (%)
Vacancy status - For seasonal, recreational, or occasional use (%)
Vacancy status - For migrant workers (%)
Vacancy status - Other vacant (%)
Residents with income below the poverty level (%)
Residents with income below 50% of the poverty level (%)
Children below poverty level (%)
Poor families by family type - Married-couple family (%)
Poor families by family type - Male, no wife present (%)
Poor families by family type - Female, no husband present (%)
Poverty status for native-born residents (%)
Poverty status for foreign-born residents (%)
Poverty among high school graduates not in families (%)
Poverty among people who did not graduate high school not in families (%)
Residents with income below the poverty level (%) - White
Residents with income below the poverty level (%) - Black or African American
Residents with income below the poverty level (%) - Asian
Residents with income below the poverty level (%) - Hispanic or Latino
Residents with income below the poverty level (%) - American Indian and Alaska Native
Residents with income below the poverty level (%) - Multirace
Residents with income below the poverty level (%) - Other Race
Air pollution - Air Quality Index (AQI)
Air pollution - CO
Air pollution - NO2
Air pollution - SO2
Air pollution - Ozone
Air pollution - PM10
Air pollution - PM25
Air pollution - Pb
Crime - Murders per 100,000 population
Crime - Rapes per 100,000 population
Crime - Robberies per 100,000 population
Crime - Assaults per 100,000 population
Crime - Burglaries per 100,000 population
Crime - Thefts per 100,000 population
Crime - Auto thefts per 100,000 population
Crime - Arson per 100,000 population
Crime - City-data.com crime index
Crime - Violent crime index
Crime - Property crime index
1996 Presidential Elections Results - Democratic Party (Clinton)
1996 Presidential Elections Results - Republican Party (Dole)
1996 Presidential Elections Results - Other
2000 Presidential Elections Results - Democratic Party (Gore)
2000 Presidential Elections Results - Republican Party (Bush)
2000 Presidential Elections Results - Other
2004 Presidential Elections Results - Democratic Party (Kerry)
2004 Presidential Elections Results - Republican Party (Bush)
2004 Presidential Elections Results - Other
2008 Presidential Elections Results - Democratic Party (Obama)
2008 Presidential Elections Results - Republican Party (McCain)
2008 Presidential Elections Results - Other
2012 Presidential Elections Results - Democratic Party (Obama)
2012 Presidential Elections Results - Republican Party (Romney)
2012 Presidential Elections Results - Other
2012 Presidential Elections Results - Democratic Party (Obama)
2012 Presidential Elections Results - Republican Party (Romney)
2012 Presidential Elections Results - Other
Ancestries Reported - Arab (%)
Ancestries Reported - Czech (%)
Ancestries Reported - Danish (%)
Ancestries Reported - Dutch (%)
Ancestries Reported - English (%)
Ancestries Reported - French (%)
Ancestries Reported - French Canadian (%)
Ancestries Reported - German (%)
Ancestries Reported - Greek (%)
Ancestries Reported - Hungarian (%)
Ancestries Reported - Irish (%)
Ancestries Reported - Italian (%)
Ancestries Reported - Lithuanian (%)
Ancestries Reported - Norwegian (%)
Ancestries Reported - Polish (%)
Ancestries Reported - Portuguese (%)
Ancestries Reported - Russian (%)
Ancestries Reported - Scotch-Irish (%)
Ancestries Reported - Scottish (%)
Ancestries Reported - Slovak (%)
Ancestries Reported - Subsaharan African (%)
Ancestries Reported - Swedish (%)
Ancestries Reported - Swiss (%)
Ancestries Reported - Ukrainian (%)
Ancestries Reported - United States (%)
Ancestries Reported - Welsh (%)
Ancestries Reported - West Indian (%)
Ancestries Reported - Other (%)
Educational Attainment - No schooling completed (%)
Educational Attainment - Less than high school (%)
Educational Attainment - High school or equivalent (%)
Educational Attainment - Less than 1 year of college (%)
Educational Attainment - 1 or more years of college (%)
Educational Attainment - Associate degree (%)
Educational Attainment - Bachelor's degree (%)
Educational Attainment - Master's degree (%)
Educational Attainment - Professional school degree (%)
Educational Attainment - Doctorate degree (%)
School Enrollment - Nursery, preschool (%)
School Enrollment - Kindergarten (%)
School Enrollment - Grade 1 to 4 (%)
School Enrollment - Grade 5 to 8 (%)
School Enrollment - Grade 9 to 12 (%)
School Enrollment - College undergrad (%)
School Enrollment - Graduate or professional (%)
School Enrollment - Not enrolled in school (%)
School enrollment - Public schools (%)
School enrollment - Private schools (%)
School enrollment - Not enrolled (%)
Median number of rooms in houses and condos
Median number of rooms in apartments
Housing units lacking complete plumbing facilities (%)
Housing units lacking complete kitchen facilities (%)
Density of houses
Urban houses (%)
Rural houses (%)
Households with people 60 years and over (%)
Households with people 65 years and over (%)
Households with people 75 years and over (%)
Households with one or more nonrelatives (%)
Households with no nonrelatives (%)
Population in households (%)
Family households (%)
Nonfamily households (%)
Population in families (%)
Family households with own children (%)
Median number of bedrooms in owner occupied houses
Mean number of bedrooms in owner occupied houses
Median number of bedrooms in renter occupied houses
Mean number of bedrooms in renter occupied houses
Median number of vehichles in owner occupied houses
Mean number of vehichles in owner occupied houses
Median number of vehichles in renter occupied houses
Mean number of vehichles in renter occupied houses
Mortgage status - with mortgage (%)
Mortgage status - with second mortgage (%)
Mortgage status - with home equity loan (%)
Mortgage status - with both second mortgage and home equity loan (%)
Mortgage status - without a mortgage (%)
Average family size
Average family size - White
Average family size - Black or African American
Average family size - Asian
Average family size - Hispanic or Latino
Average family size - American Indian and Alaska Native
Average family size - Multirace
Average family size - Other Race
Geographical mobility - Same house 1 year ago (%)
Geographical mobility - Moved within same county (%)
Geographical mobility - Moved from different county within same state (%)
Geographical mobility - Moved from different state (%)
Geographical mobility - Moved from abroad (%)
Place of birth - Born in state of residence (%)
Place of birth - Born in other state (%)
Place of birth - Native, outside of US (%)
Place of birth - Foreign born (%)
Housing units in structures - 1, detached (%)
Housing units in structures - 1, attached (%)
Housing units in structures - 2 (%)
Housing units in structures - 3 or 4 (%)
Housing units in structures - 5 to 9 (%)
Housing units in structures - 10 to 19 (%)
Housing units in structures - 20 to 49 (%)
Housing units in structures - 50 or more (%)
Housing units in structures - Mobile home (%)
Housing units in structures - Boat, RV, van, etc. (%)
House/condo owner moved in on average (years ago)
Renter moved in on average (years ago)
Year householder moved into unit - Moved in 1999 to March 2000 (%)
Year householder moved into unit - Moved in 1995 to 1998 (%)
Year householder moved into unit - Moved in 1990 to 1994 (%)
Year householder moved into unit - Moved in 1980 to 1989 (%)
Year householder moved into unit - Moved in 1970 to 1979 (%)
Year householder moved into unit - Moved in 1969 or earlier (%)
Means of transportation to work - Drove car alone (%)
Means of transportation to work - Carpooled (%)
Means of transportation to work - Public transportation (%)
Means of transportation to work - Bus or trolley bus (%)
Means of transportation to work - Streetcar or trolley car (%)
Means of transportation to work - Subway or elevated (%)
Means of transportation to work - Railroad (%)
Means of transportation to work - Ferryboat (%)
Means of transportation to work - Taxicab (%)
Means of transportation to work - Motorcycle (%)
Means of transportation to work - Bicycle (%)
Means of transportation to work - Walked (%)
Means of transportation to work - Other means (%)
Working at home (%)
Industry diversity
Most Common Industries - Agriculture, forestry, fishing and hunting, and mining (%)
Most Common Industries - Agriculture, forestry, fishing and hunting (%)
Most Common Industries - Mining, quarrying, and oil and gas extraction (%)
Most Common Industries - Construction (%)
Most Common Industries - Manufacturing (%)
Most Common Industries - Wholesale trade (%)
Most Common Industries - Retail trade (%)
Most Common Industries - Transportation and warehousing, and utilities (%)
Most Common Industries - Transportation and warehousing (%)
Most Common Industries - Utilities (%)
Most Common Industries - Information (%)
Most Common Industries - Finance and insurance, and real estate and rental and leasing (%)
Most Common Industries - Finance and insurance (%)
Most Common Industries - Real estate and rental and leasing (%)
Most Common Industries - Professional, scientific, and management, and administrative and waste management services (%)
Most Common Industries - Professional, scientific, and technical services (%)
Most Common Industries - Management of companies and enterprises (%)
Most Common Industries - Administrative and support and waste management services (%)
Most Common Industries - Educational services, and health care and social assistance (%)
Most Common Industries - Educational services (%)
Most Common Industries - Health care and social assistance (%)
Most Common Industries - Arts, entertainment, and recreation, and accommodation and food services (%)
Most Common Industries - Arts, entertainment, and recreation (%)
Most Common Industries - Accommodation and food services (%)
Most Common Industries - Other services, except public administration (%)
Most Common Industries - Public administration (%)
Occupation diversity
Most Common Occupations - Management, business, science, and arts occupations (%)
Most Common Occupations - Management, business, and financial occupations (%)
Most Common Occupations - Management occupations (%)
Most Common Occupations - Business and financial operations occupations (%)
Most Common Occupations - Computer, engineering, and science occupations (%)
Most Common Occupations - Computer and mathematical occupations (%)
Most Common Occupations - Architecture and engineering occupations (%)
Most Common Occupations - Life, physical, and social science occupations (%)
Most Common Occupations - Education, legal, community service, arts, and media occupations (%)
Most Common Occupations - Community and social service occupations (%)
Most Common Occupations - Legal occupations (%)
Most Common Occupations - Education, training, and library occupations (%)
Most Common Occupations - Arts, design, entertainment, sports, and media occupations (%)
Most Common Occupations - Healthcare practitioners and technical occupations (%)
Most Common Occupations - Health diagnosing and treating practitioners and other technical occupations (%)
Most Common Occupations - Health technologists and technicians (%)
Most Common Occupations - Service occupations (%)
Most Common Occupations - Healthcare support occupations (%)
Most Common Occupations - Protective service occupations (%)
Most Common Occupations - Fire fighting and prevention, and other protective service workers including supervisors (%)
Most Common Occupations - Law enforcement workers including supervisors (%)
Most Common Occupations - Food preparation and serving related occupations (%)
Most Common Occupations - Building and grounds cleaning and maintenance occupations (%)
Most Common Occupations - Personal care and service occupations (%)
Most Common Occupations - Sales and office occupations (%)
Most Common Occupations - Sales and related occupations (%)
Most Common Occupations - Office and administrative support occupations (%)
Most Common Occupations - Natural resources, construction, and maintenance occupations (%)
Most Common Occupations - Farming, fishing, and forestry occupations (%)
Most Common Occupations - Construction and extraction occupations (%)
Most Common Occupations - Installation, maintenance, and repair occupations (%)
Most Common Occupations - Production, transportation, and material moving occupations (%)
Most Common Occupations - Production occupations (%)
Most Common Occupations - Transportation occupations (%)
Most Common Occupations - Material moving occupations (%)
People in Group quarters - Institutionalized population (%)
People in Group quarters - Correctional institutions (%)
People in Group quarters - Federal prisons and detention centers (%)
People in Group quarters - Halfway houses (%)
People in Group quarters - Local jails and other confinement facilities (including police lockups) (%)
People in Group quarters - Military disciplinary barracks (%)
People in Group quarters - State prisons (%)
People in Group quarters - Other types of correctional institutions (%)
People in Group quarters - Nursing homes (%)
People in Group quarters - Hospitals/wards, hospices, and schools for the handicapped (%)
People in Group quarters - Hospitals/wards and hospices for chronically ill (%)
People in Group quarters - Hospices or homes for chronically ill (%)
People in Group quarters - Military hospitals or wards for chronically ill (%)
People in Group quarters - Other hospitals or wards for chronically ill (%)
People in Group quarters - Hospitals or wards for drug/alcohol abuse (%)
People in Group quarters - Mental (Psychiatric) hospitals or wards (%)
People in Group quarters - Schools, hospitals, or wards for the mentally retarded (%)
People in Group quarters - Schools, hospitals, or wards for the physically handicapped (%)
People in Group quarters - Institutions for the deaf (%)
People in Group quarters - Institutions for the blind (%)
People in Group quarters - Orthopedic wards and institutions for the physically handicapped (%)
People in Group quarters - Wards in general hospitals for patients who have no usual home elsewhere (%)
People in Group quarters - Wards in military hospitals for patients who have no usual home elsewhere (%)
People in Group quarters - Juvenile institutions (%)
People in Group quarters - Long-term care (%)
People in Group quarters - Homes for abused, dependent, and neglected children (%)
People in Group quarters - Residential treatment centers for emotionally disturbed children (%)
People in Group quarters - Training schools for juvenile delinquents (%)
People in Group quarters - Short-term care, detention or diagnostic centers for delinquent children (%)
People in Group quarters - Type of juvenile institution unknown (%)
People in Group quarters - Noninstitutionalized population (%)
People in Group quarters - College dormitories (includes college quarters off campus) (%)
People in Group quarters - Military quarters (%)
People in Group quarters - On base (%)
People in Group quarters - Barracks, unaccompanied personnel housing (UPH), (Enlisted/Officer), ;and similar group living quarters for military personnel (%)
People in Group quarters - Transient quarters for temporary residents (%)
People in Group quarters - Military ships (%)
People in Group quarters - Group homes (%)
People in Group quarters - Homes or halfway houses for drug/alcohol abuse (%)
People in Group quarters - Homes for the mentally ill (%)
People in Group quarters - Homes for the mentally retarded (%)
People in Group quarters - Homes for the physically handicapped (%)
People in Group quarters - Other group homes (%)
People in Group quarters - Religious group quarters (%)
People in Group quarters - Dormitories (%)
People in Group quarters - Agriculture workers' dormitories on farms (%)
People in Group quarters - Job Corps and vocational training facilities (%)
People in Group quarters - Other workers' dormitories (%)
People in Group quarters - Crews of maritime vessels (%)
People in Group quarters - Other nonhousehold living situations (%)
People in Group quarters - Other noninstitutional group quarters (%)
Residents speaking English at home (%)
Residents speaking English at home - Born in the United States (%)
Residents speaking English at home - Native, born elsewhere (%)
Residents speaking English at home - Foreign born (%)
Residents speaking Spanish at home (%)
Residents speaking Spanish at home - Born in the United States (%)
Residents speaking Spanish at home - Native, born elsewhere (%)
Residents speaking Spanish at home - Foreign born (%)
Residents speaking other language at home (%)
Residents speaking other language at home - Born in the United States (%)
Residents speaking other language at home - Native, born elsewhere (%)
Residents speaking other language at home - Foreign born (%)
Class of Workers - Employee of private company (%)
Class of Workers - Self-employed in own incorporated business (%)
Class of Workers - Private not-for-profit wage and salary workers (%)
Class of Workers - Local government workers (%)
Class of Workers - State government workers (%)
Class of Workers - Federal government workers (%)
Class of Workers - Self-employed workers in own not incorporated business and Unpaid family workers (%)
House heating fuel used in houses and condos - Utility gas (%)
House heating fuel used in houses and condos - Bottled, tank, or LP gas (%)
House heating fuel used in houses and condos - Electricity (%)
House heating fuel used in houses and condos - Fuel oil, kerosene, etc. (%)
House heating fuel used in houses and condos - Coal or coke (%)
House heating fuel used in houses and condos - Wood (%)
House heating fuel used in houses and condos - Solar energy (%)
House heating fuel used in houses and condos - Other fuel (%)
House heating fuel used in houses and condos - No fuel used (%)
House heating fuel used in apartments - Utility gas (%)
House heating fuel used in apartments - Bottled, tank, or LP gas (%)
House heating fuel used in apartments - Electricity (%)
House heating fuel used in apartments - Fuel oil, kerosene, etc. (%)
House heating fuel used in apartments - Coal or coke (%)
House heating fuel used in apartments - Wood (%)
House heating fuel used in apartments - Solar energy (%)
House heating fuel used in apartments - Other fuel (%)
House heating fuel used in apartments - No fuel used (%)
Armed forces status - In Armed Forces (%)
Armed forces status - Civilian (%)
Armed forces status - Civilian - Veteran (%)
Armed forces status - Civilian - Nonveteran (%)
Mar. 2016 cost of living index in Monona: 84.7 (less than average, U.S. average is 100)
Latest news from Monona, IA collected exclusively by city-data.com from local newspapers, TV, and radio stations
on Wednesday scheduled Eliot Stowe's trial for Sept. 10 in
Monona County District Court. His trial had been scheduled to begin Tuesday.
(siouxcityjournal.com)
Monona County District Court records say a judge Wednesday set Sept. 10 as the new trial starting date for 21-year-old Eliot Stowe. The trial had been scheduled to
(kcrg.com)
Firefighters were called to a residence in rural
Monona County to fight a garage fire.
(ktiv.com)
");Ancestries: German (58.7%), Norwegian (10.5%), Irish (5.9%), American (5.5%), English (3.0%), Polish (1.3%).
Current Local Time:
Incorporated on 05/11/1897
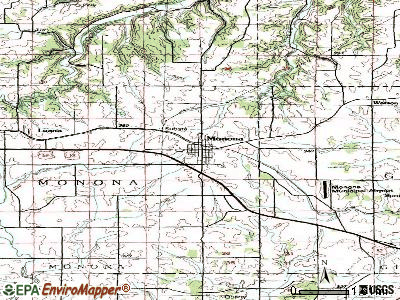
Land area: 1.15 square miles.
Population density: 1,310 people per square mile (low).
For population 25 years and over in Monona:
High school or higher: 90.2%Bachelor's degree or higher: 20.3%Graduate or professional degree: 3.6%Unemployed: 4.9%Mean travel time to work (commute): 16.0 minutes For population 15 years and over in Monona city:
Never married: 21.4%Now married: 60.1%Separated: 0.3%Widowed: 10.9%Divorced: 7.3% 16 residents are foreign born
Median real estate property taxes paid for housing units with mortgages in 2016: $1,907 (1.6%)Median real estate property taxes paid for housing units with no mortgage in 2016: $1,557 (1.6%)
Nearest city with pop. 50,000+: Dubuque, IA
Nearest city with pop. 200,000+: Madison, WI
Nearest city with pop. 1,000,000+: Chicago, IL
Nearest cities: Luana, IA (1.8 miles Farmersburg, IA (2.6 miles Postville, IA Marquette, IA McGregor, IA Prairie du Chien, WI
Single-family new house construction building permits:
1997: 2 buildings , average cost: $95,0001998: 3 buildings , average cost: $68,3001999: 6 buildings , average cost: $82,5002000: 1 building , cost: $115,0002005: 3 buildings , average cost: $105,0002006: 5 buildings , average cost: $172,4002008: 9 buildings , average cost: $91,1002009: 2 buildings , average cost: $182,5002010: 2 buildings , average cost: $240,0002011: 1 building , cost: $300,0002012: 2 buildings , average cost: $262,5002013: 2 buildings , average cost: $250,000
Number of permits per 10,000 residents
Latitude: 43.05 N, Longitude: 91.39 W
Unemployment in September 2015:
Population change in the 1990s: +31 (+2.0%).
Most common industries in 2016 (%)
Males Females
Manufacturing (30%)Construction (13%)Retail trade (9%)Agriculture, forestry, fishing and hunting (8%)Transportation and warehousing (8%)Educational services (7%)Other services, except public administration (4%)
Health care and social assistance (26%)Manufacturing (24%)Retail trade (15%)Other services, except public administration (7%)Educational services (6%)Accommodation and food services (4%)Finance and insurance (4%)
Most common occupations in 2016 (%)
Males Females
Production occupations (17%)Transportation occupations (13%)Office and administrative support occupations (10%)Installation, maintenance, and repair occupations (10%)Management occupations (9%)Construction and extraction occupations (8%)Education, training, and library occupations (5%)
Office and administrative support occupations (27%)Production occupations (12%)Personal care and service occupations (11%)Sales and related occupations (9%)Food preparation and serving related occupations (8%)Healthcare support occupations (6%)Community and social service occupations (6%)
Work and jobs in Monona: detailed stats about occupations, industries, unemployment, workers, commute
Tornado activity:
Monona-area historical tornado activity is slightly below Iowa state average. It is 59% greater than the overall U.S. average.
On 5/15/1968, a category F5 (max. wind speeds 261-318 mph) tornado 27.1 miles away from the Monona city center killed 5 people and injured 156 people and caused between $5,000,000 and $50,000,000 in damages.
On 4/30/1954, a category F4 (max. wind speeds 207-260 mph) tornado 14.3 miles away from the city center .
Earthquake activity:
Monona-area historical earthquake activity is slightly below Iowa state average. It is 86% smaller than the overall U.S. average. On 4/18/2008 at 09:36:59, a magnitude 5.4 (5.1 MB, 4.8 MS, 5.4 MW, 5.2 MW, Depth: 8.9 mi, Class: Moderate, Intensity: VI - VII) earthquake occurred 367.2 miles away from the city center On 6/28/2004 at 06:10:52, a magnitude 4.2 (4.0 MB, 4.2 MW, Depth: 6.2 mi, Class: Light, Intensity: IV - V) earthquake occurred 168.4 miles away from Monona center On 6/10/1987 at 23:48:54, a magnitude 5.1 (4.9 MB, 4.4 MS, 4.6 MS, 5.1 LG) earthquake occurred 345.1 miles away from the city center On 7/9/1975 at 14:54:15, a magnitude 4.6 (4.6 MB) earthquake occurred 292.6 miles away from the city center On 9/2/1999 at 16:17:29, a magnitude 3.5 (3.5 LG, Depth: 3.1 mi, Class: Light, Intensity: II - III) earthquake occurred 135.9 miles away from Monona center On 6/18/2002 at 17:37:15, a magnitude 5.0 (4.3 MB, 4.6 MW, 5.0 LG, Depth: 3.1 mi) earthquake occurred 398.3 miles away from the city center Magnitude types: regional Lg-wave magnitude (LG), body-wave magnitude (MB), surface-wave magnitude (MS), moment magnitude (MW) Natural disasters: The number of natural disasters in Clayton County (23) is a lot greater than the US average (13).Major Disasters (Presidential) Declared: 22Emergencies Declared: 1Floods: 22, Storms: 18, Tornadoes: 9, Winds: 3, Heavy Rain: 1, Hurricane: 1 (Note: Some incidents may be assigned to more than one category). Hospitals and medical centers near Monona: GOOD SAMARITAN SOCIETY - POSTVILLE (Nursing Home, about 9 miles away; POSTVILLE, IA)
GREAT RIVER CARE CENTER (Nursing Home, about 11 miles away; MC GREGOR, IA)
GUNDERSEN LUTHERAN RENAL DIALYSIS - PRAIRIE DU CHIEN (Dialysis Facility, about 13 miles away; PRAIRIE DU CHIEN, WI)
PRAIRIE DU CHIEN MEM HSPTL (about 13 miles away; PRAIRIE DU CHIEN, WI)
PRAIRIE MAISON (Nursing Home, about 13 miles away; PRAIRIE DU CHIEN, WI)
CLAYTON COUNTY VISITING NURSE ASSOCIATION (Home Health Center, about 14 miles away; ELKADER, IA)
CENTRAL COMMUNITY HOSPITAL (about 14 miles away; ELKADER, IA)
airports located in Monona: Colleges/universities with over 2000 students nearest to Monona:
Upper Iowa University (about 26 miles; Fayette, IA ; Full-time enrollment: 5,275)
Northeast Iowa Community College-Calmar (about 26 miles; Calmar, IA ; FT enrollment: 3,365)
Luther College (about 28 miles; Decorah, IA ; FT enrollment: 2,700)
University of Wisconsin-Platteville (about 51 miles; Platteville, WI ; FT enrollment: 7,679)
Viterbo University (about 53 miles; La Crosse, WI ; FT enrollment: 2,848)
Western Technical College (about 54 miles; La Crosse, WI ; FT enrollment: 3,377)
University of Wisconsin-La Crosse (about 54 miles; La Crosse, WI ; FT enrollment: 9,837)
Public high school in Monona: MFL MARMAC HS Students: 382, Location: 700 S PAGE ST, Grades: 9-12)Public elementary/middle school in Monona:
See full list of schools located in Monona Library in Monona: MURPHY MEMORIAL LIBRARY Operating income: $49,552; Location: 111 N PAGE ST; 12,777 books ; 414 audio materials ; 586 video materials ; 25 state licensed databases ; 36 print serial subscriptions ; 2 electronic serial subscriptions )
Notable locations in Monona: (A) , Gateway Park Campground (B) , Monona - Farmersburg - Luana Ambulance Service Incorporated (C) , Monona Police Department (D) , Monona Historical Museum (E) , Monona Fire Department (F) , Murphy Memorial Library (G) . Display/hide their locations on the map
Churches in Monona include: (A) , Saint Patricks Church (B) , Garden City United Methodist Church (C) . Display/hide their locations on the map
Cemeteries: (1) , Monona Cemetery (2) . Display/hide their locations on the map
Parks in Monona include: (1) , Gateway Park (2) . Display/hide their locations on the map
Tourist attraction:
Hotel:
Clayton County has a predicted average indoor radon screening level greater than 4 pCi/L (pico curies per liter) - Highest Potential Percentage of residents living in poverty in 2016: 9.1%for White Non-Hispanic residents , 33.3% for two or more races residents )Average household size:
This city: Iowa:
Percentage of family households:
This city: Whole state:
Percentage of households with unmarried partners:
This city: Whole state:
Likely homosexual households (counted as self-reported same-sex unmarried-partner households)
Lesbian couples: 0.0% of all households Gay men: 0.1% of all households
Banks with branches in Monona (2011 data):
FreedomBank: Monona Office Branch at 106 South Main Street, branch established on 1933/05/01. Info updated 2006/12/22: Bank assets: $225.5 mil, Deposits: $189.9 mil, headquarters in Elkader, IA, positive income , Agricultural Specialization, 3 total offices , Holding Company: Leroy C. Darby, Inc. Esop
Educational Attainment (%) in 2016
School Enrollment by Level of School (%) in 2016
Education Gini index (Inequality in education) Here:
9.7Iowa average:
10.4
Presidential Elections Results
1996 2000 2004 2008 2012 2016
1996 Presidential Elections Results
2000 Presidential Elections Results
2004 Presidential Elections Results
2008 Presidential Elections Results
2012 Presidential Elections Results
2016 Presidential Elections Results
Graphs represent county-level data. Detailed 2008 Election Results
Religion statistics for Monona city (based on Clayton County data)
Religion Adherents Congregations Mainline Protestant 6,656 24 Catholic 4,351 8 Evangelical Protestant 1,174 15 Other 250 3 None 5,698 -
Source: Clifford Grammich, Kirk Hadaway, Richard Houseal, Dale E.Jones, Alexei Krindatch, Richie Stanley and Richard H.Taylor. 2012. 2010 U.S.Religion Census: Religious Congregations & Membership Study. Association of Statisticians of American Religious Bodies. Jones, Dale E., et al. 2002. Congregations and Membership in the United States 2000. Nashville, TN: Glenmary Research Center. Graphs represent county-level data
Food Environment Statistics: Number of grocery stores : 6Clayton County :
3.40 / 10,000 pop.Iowa :
2.14 / 10,000 pop.
Number of convenience stores (with gas) : 13Clayton County :
7.36 / 10,000 pop.State :
5.55 / 10,000 pop.
Number of full-service restaurants : 23Here :
13.01 / 10,000 pop.State :
8.01 / 10,000 pop.
Adult diabetes rate : This county :
8.3%Iowa :
7.8%
Adult obesity rate : Clayton County :
28.4%Iowa :
27.3%
Low-income preschool obesity rate : This county :
15.5%State :
14.5%
Local government employment and payroll (March 2012)
Function
Full-time employees
Monthly full-time payroll
Average yearly full-time wage
Part-time employees
Monthly part-time payroll
Other Government Administration
2 $7,284 $43,704 7 $2,764 Police Protection - Officers
2 $6,711 $40,266 0 $0 Streets and Highways
1 $3,201 $38,412 0 $0 Solid Waste Management
1 $3,168 $38,016 0 $0 Water Supply
1 $3,675 $44,100 0 $0 Local Libraries
0 $0 2 $2,535
Totals for Government
7 $24,039 $41,210 9 $5,299
Monona government finances - Expenditure in 2002 (per resident):
Construction - Fire Protection: $447,000 ($296.03)
Current Operations - Sewerage: $239,000 ($158.28)
Solid Waste Management: $151,000 ($100.00)Regular Highways: $128,000 ($84.77)Police Protection: $114,000 ($75.50)Water Utilities: $107,000 ($70.86)Parks & Recreation: $60,000 ($39.74)Financial Administration: $60,000 ($39.74)Libraries: $43,000 ($28.48)General - Other: $38,000 ($25.17)Fire Protection: $21,000 ($13.91)Air Transportation: $10,000 ($6.62)Central Staff Services: $8,000 ($5.30)Health Services - Other: $6,000 ($3.97)General Public Buildings: $5,000 ($3.31)Welfare - Other: $3,000 ($1.99)Judicial and Legal Services: $2,000 ($1.32)General - Interest on Debt: $6,000 ($3.97)
Intergovernmental to Local NEC - Regular Highways: $17,000 ($11.26)
Health: $3,000 ($1.99)General: $3,000 ($1.99)Police Protection: $2,000 ($1.32)Intergovernmental to State - General: $1,000 ($0.66)
Other Capital Outlay - Housing & Community Development: $89,000 ($58.94)
Parks & Recreation: $65,000 ($43.05)General - Other: $60,000 ($39.74)Total Salaries & Wages: $306,000 ($202.65)
Monona government finances - Revenue in 2002 (per resident):
Charges - Air Transportation: $4,000 ($2.65)
Charges - Sewerage: $137,000 ($90.73)
Solid Waste Management: $101,000 ($66.89)Parks & Recreation: $20,000 ($13.25)All Other: $10,000 ($6.62)Federal Intergovernmental - Housing & Community Development: $74,000 ($49.01)
Local Intergovernmental - All Other: $7,000 ($4.64)
Miscellaneous - General Revenue, NEC: $234,000 ($154.97)
Interest Earnings: $34,000 ($22.52)Rents: $10,000 ($6.62)Special Assessments: $7,000 ($4.64)Revenue - Water Utilities: $119,000 ($78.81)
State Intergovernmental - Highways: $124,000 ($82.12)
General Support: $30,000 ($19.87)All Other: $19,000 ($12.58)Tax - Property: $331,000 ($219.21)
Total General Sales: $89,000 ($58.94)NEC: $4,000 ($2.65)
Monona government finances - Debt in 2002 (per resident):
Long Term Debt Beginning Outstanding, NEC: $107,000 ($70.86)
Long Term Debt Issue, Unspecified - Other NEC: $440,000 ($291.39)
Long Term Debt Outstanding - Full Faith & Credit - Other, NEC: $512,000 ($339.07)
Long Term Debt Retired Unspecified - Other, NEC: $35,000 ($23.18)
Monona government finances - Cash and Securities in 2002 (per resident):
Other Funds - Cash & Deposits: $1,206,000 ($798.68)
4.49% of this county's 2011 resident taxpayers lived in other counties in 2010 ($39,278 average adjusted gross income )
Here:
4.49%Iowa average:
5.75%
10 or fewer of this county's residents moved from foreign countries between 2010 and 2011.
Top counties from which taxpayers relocated into this county between 2010 and 2011:
5.09% of this county's 2010 resident taxpayers moved to other counties in 2011 ($29,688 average adjusted gross income )
Here:
5.09%Iowa average:
5.94%
10 or fewer of this county's residents moved to foreign countries between 2010 and 2011.
Top counties to which taxpayers relocated from this county between 2010 and 2011: Strongest AM radio stations in Monona:
WPRE (980 AM; 1 kW; PRAIRIE DU CHIEN, WI; Owner: ROBINSON CORPORATION)
KXEL (1540 AM; 50 kW; WATERLOO, IA; Owner: KXEL BROADCASTING COMPANY, INC.)
KNEI (1140 AM; 2 kW; WAUKON, IA; Owner: WENNES COMMUNICATIONS STATIONS, INC.)
KADR (1400 AM; 1 kW; ELKADER, IA; Owner: DESIGN HOMES, INC.)
KKHQ (950 AM; 5 kW; OELWEIN, IA; Owner: CUMULUS LICENSING CORP.)
WKTY (580 AM; 5 kW; LA CROSSE, WI; Owner: FAMILY RADIO, INC.)
WSPT (1010 AM; 50 kW; STEVENS POINT, WI)
WTMJ (620 AM; 50 kW; MILWAUKEE, WI; Owner: JOURNAL BROADCAST CORPORATION)
WHO (1040 AM; 50 kW; DES MOINES, IA; Owner: CITICASTERS LICENSES, L.P.)
WCTS (1030 AM; 50 kW; MAPLEWOOD, MN; Owner: CNTL. BAPT. THEO/AL SEMI MINNEAPOLIS)
WSCR (670 AM; 50 kW; CHICAGO, IL; Owner: INFINITY BROADCASTING OPERATIONS, INC.)
KFAN (1130 AM; 50 kW; MINNEAPOLIS, MN; Owner: AMFM RADIO LICENSES, L.L.C.)
WGN (720 AM; 50 kW; CHICAGO, IL; Owner: WGN CONTINENTAL BROADCASTING CO.)
Strongest FM radio stations in Monona:
KOEL-FM (92.3 FM; OELWEIN, IA; Owner: CUMULUS LICENSING CORP.)
WQPC (94.3 FM; PRAIRIE DU CHIEN, WI; Owner: ROBINSON CORPORATION)
KNEI-FM (103.5 FM; WAUKON, IA; Owner: WENNES COMMUNICATIONS STATIONS, INC.)
KPVL (89.1 FM; POSTVILLE, IA; Owner: POSTVILLE CHAMBER OF COMMERCE)
KCTN (100.1 FM; GARNAVILLO, IA; Owner: DESIGN HOMES, INC.)
KFMW (107.9 FM; WATERLOO, IA; Owner: KXEL BROADCASTING COMPANY, INC.)
KUNI (90.9 FM; CEDAR FALLS, IA; Owner: UNIVERSITY OF NORTHERN IOWA)
KVIK (104.7 FM; DECORAH, IA; Owner: WENNES COMMUNICATIONS STATIONS, INC.)
KDEC-FM (100.5 FM; DECORAH, IA; Owner: DECORAH BROADCASTING, INC.)
TV broadcast stations around Monona:
KWWL (Channel 7; WATERLOO, IA; Owner: RAYCOM AMERICA, INC.)
KGAN (Channel 2; CEDAR RAPIDS, IA; Owner: KGAN LICENSEE, LLC)
KCRG-TV (Channel 9; CEDAR RAPIDS, IA; Owner: CEDAR RAPIDS TELEVISION CO.)
KRIN (Channel 32; WATERLOO, IA; Owner: IOWA PUBLIC BROADCASTING BOARD)
K41AD (Channel 41; LANSING, IA; Owner: IOWA PUBLIC BROADCASTING BOARD)
W22CI (Channel 22; BLOOMINGTON, WI; Owner: STATE OF WISCONSIN - EDUCATIONAL COMMUNICATIONS BOARD)
K14AF (Channel 14; DECORAH, IA; Owner: IOWA PUBLIC BROADCASTING BOARD)
Monona fatal accident list:
Jan 16, 2004 06:20 AM, N West St, Vehicles: 1, Persons: 1, Fatalities: 1
FCC Registered Antenna Towers: 6
Janean K Amundson, 600 E. North Street (Lat: 43.055528 Lon: -91.380917), Type: 94.4, Overall height: 91.4 m, Registrant: 2027757960, Jtroup@arterhadden.Com, 1801 K STREET, NW, SUITE 400-K Janean K Amundson, 600 E. North Street (Lat: 43.055528 Lon: -91.380917), Type: 94.4, Overall height: 91.4 m, Registrant: 2027757960, Jtroup@arterhadden.Com, 1801 K STREET, NW, SUITE 400-K LORI DAWSON, 21200 125thstreet (Lat: 43.043056 Lon: -91.381667), Type: 94.1, Overall height: 91.4 m, Registrant: 2028625989, Pconnolly2hklaw.Com, 2099 PENNSYLVANIA AVE NW, STE 100 LORI DAWSON, 21200 125thstreet (Lat: 43.043056 Lon: -91.381667), Type: 94.1, Overall height: 91.4 m, Registrant: 2028625989, Pconnolly2hklaw.Com, 2099 PENNSYLVANIA AVE NW, STE 100 David Byers, 600 E. North Street (Lat: 43.055528 Lon: -91.380917), Type: 94.4, Overall height: 91.4 m, Registrant: 5635392122, Dabyers@neitel.Com, 800 S. MAIN STREET STEVEN T CAMPBELL, 21200 125thstreet (Lat: 43.043056 Lon: -91.381667), Type: 94.1, Structure height: 19043 m, Overall height: 91.4 m, Registrant: 2028625989, Peter.Connolly@hklaw.Com, 800 17TH STREET NW, STE 1100 FCC Registered Commercial Land Mobile Towers: 1
114 N Main (Lat: 43.049694 Lon: -91.388750), Structure height: 32 m, Call Sign: WNZT341, Licensee ID: L00042647Assigned Frequencies: 861.112 MHz, 862.112 MHz, 863.112 MHz, 864.112 MHz, 865.112 MHzGrant Date: 06/24/1997, Expiration Date: 06/24/2002, Cancellation Date: 09/08/2002Registrant: United Cooperative Assn, 114 N Main, Monona, IA 52159, Phone: (319) 539-2640 FCC Registered Private Land Mobile Towers: 4
606 W Iowa St (Lat: 43.047194 Lon: -91.393194), Call Sign: KYB249, Licensee ID: L00042701Assigned Frequencies: 151.715 MHzGrant Date: 09/23/2011, Expiration Date: 11/12/2021, Cancellation Date: 02/06/2013Registrant: D & J Feed Service Inc, 606 W Iowa St, Monona, IA 52159, Phone: (319) 539-2037 1/2 Mi S Of Hwy 18 (Lat: 43.036083 Lon: -91.402917), Call Sign: KNFB264Assigned Frequencies: 152.975 MHzGrant Date: 03/22/2012, Expiration Date: 04/02/2022Registrant: 13583 Fox Avenue, Monona, IA 52159-8043, Phone: (563) 539-4382, Email:
1/4 Mi N City Limits (Lat: 43.065250 Lon: -91.391806), Call Sign: KVA769Assigned Frequencies: 151.580 MHzGrant Date: 01/14/2014, Expiration Date: 03/30/2024, Certifier: Shane HassRegistrant: Racom Corp., 201 W. State St., Marshalltown, IA 50158, Phone: (888) 752-1016, Fax: (641) 752-0674, Email:
Mobile-L1-Monona, Lat: 43.055889 Lon: -91.396000, Call Sign: WQUW498Assigned Frequencies: 161.370 MHz, 160.770 MHz, 161.430 MHz, 161.085 MHzGrant Date: 10/30/2014, Expiration Date: 10/30/2024, Cancellation Date: 10/13/2015, Certifier: Tom ByersRegistrant: Dakota, Minnesota & Eastern Railroad Corporation, 120 South 6th Street, Minneapolis, MN 55402, Phone: (403) 319-3626, Email:
FCC Registered Microwave Towers: 2
MONONA, 600 E. North Street (Lat: 43.055528 Lon: -91.380917), Type: Gtower, Structure height: 91.4 m, Overall height: 94.4 m, Call Sign: WQES627Assigned Frequencies: 6063.80 MHz, 10735.0 MHz, 10815.0 MHz, 10815.0 MHz, 10815.0 MHzGrant Date: 02/06/2016, Expiration Date: 04/04/2026, Certifier: David ByersRegistrant: Pcs Technologies, Inc, 30 W. Water Street, St. Paul, MN 55107, Phone: (651) 222-5881, Fax: (651) 228-2645, Email:
MONONA, 21200 125th Street (Lat: 43.043056 Lon: -91.381667), Type: Gtower, Structure height: 91.4 m, Overall height: 94.1 m, Call Sign: WQIN344Assigned Frequencies: 6286.19 MHzGrant Date: 03/25/2008, Expiration Date: 03/25/2018, Certifier: John E RooneyRegistrant: Holland & Knight LLP, 800 17th Street, N.W., Suite #1100, Washington, DC 20006-3906, Phone: (202) 955-3000, Fax: (202) 955-5564, Email:
FCC Registered Paging Towers: 2
210 North Hill (Lat: 43.054972 Lon: -91.396778), Call Sign: KNKD820, Licensee ID: L00001435Assigned Frequencies: 454.400 MHzGrant Date: 08/03/1998, Expiration Date: 07/01/2008, Cancellation Date: 08/16/2008Registrant: Northeast Iowa Telephone Co., 115 North Page Street, Monona, IA 52159 115 North Page (Lat: 43.053306 Lon: -91.390667), Call Sign: WSI689, Licensee ID: L00001435Assigned Frequencies: 152.840 MHzGrant Date: 08/03/1998, Expiration Date: 07/01/2008, Cancellation Date: 08/16/2008Registrant: Northeast Iowa Telephone Company, 115 North Page Street, Monona, IA 52159 FCC Registered Amateur Radio Licenses: 5
Call Sign: KB0SVS, Grant Date: 05/26/1995, Expiration Date: 05/26/2005, Cancellation Date: 05/27/2007, Registrant: Bryan S Wilkins, 107 Fair St, Monona, IA 52159Call Sign: N0YKY, Grant Date: 09/07/1993, Expiration Date: 09/07/2003, Cancellation Date: 09/08/2005, Registrant: Derrick E Peters, Rr1 Box 186, Monona, IA 52159Call Sign: W0SFK, Licensee ID: L00052519, Grant Date: 06/13/2007, Expiration Date: 06/20/2017, Certifier: Elmer L Marting, Registrant: Elmer L Marting, 504 S Egbert St, Monona, IA 52159-0279Call Sign: W0YPT, Licensee ID: L00900149, Grant Date: 08/02/2004, Expiration Date: 10/19/2014, Certifier: Telmer G Olson, Registrant: Telmer G Olson, 304 W Iowa St, Monona, IA 52159Call Sign: W0YRM, Grant Date: 07/15/1994, Expiration Date: 07/15/2004, Cancellation Date: 07/18/2006, Registrant: Sidney L Chickering, 206 S Hill, Monona, IA 52159FAA Registered Aircraft: 2
Aircraft: WATERS KENNETH R CORBEN JUNIOR ACE (Category: Land, Seats: 2, Weight: Up to 12,499 Pounds), Engine: CONT MOTOR A75-8 (75 HP) (4 Cycle)N-Number: 941KW , Serial Number: 941, Year manufactured: 2012, Airworthiness Date: 07/23/2013Registrant (Corporation): Waters Kenneth R, Po Box 756, Monona, IA 52159Aircraft: TAYLORCRAFT BC12-D (Category: Land, Seats: 2, Weight: Up to 12,499 Pounds, Speed: 78 mph), Engine: CONT MOTOR A&C65 SERIES (65 HP) (Reciprocating)N-Number: 96841 , Serial Number: 9136, Year manufactured: 1946, Airworthiness Date: 07/24/1946Registrant (Individual): Elmer L Marting, Po Box 972, Monona, IA 52159Deregistered: Cancel Date: 09/01/1995, Exported to: India Drinking water stations with addresses in Monona and their reported violations in the past:
LUNDS CAMP INC (Address: 1492 LINTON DR Population served: 72, Groundwater):
Past monitoring violations:
One routine major monitoring violation
One regular monitoring violation
Drinking water stations with addresses in Monona that have no violations reported:
FARMERSBURG WATERWORKS (Address: 404 SOUTH EGBERT ST Population served: 302, Primary Water Source Type: Groundwater)
Most common first names in Monona, IA among deceased individuals Name Count Lived (average)
John 22 75.3 years Harold 14 76.4 years Donald 13 74.5 years George 13 78.4 years Walter 13 80.2 years Mary 13 78.9 years William 13 79.9 years Irene 13 83.5 years Robert 12 70.3 years Elmer 11 80.5 years
Most common last names in Monona, IA among deceased individuals Last name Count Lived (average)
Schlitter 15 80.5 years Lenth 14 83.0 years Schultz 13 80.7 years Kruse 11 82.1 years Miller 10 86.2 years Smith 10 82.1 years Kaiser 10 84.9 years Wiethorn 9 82.4 years Thompson 9 81.2 years Melcher 8 85.4 years
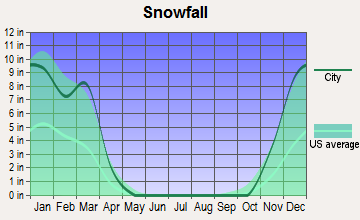
Most commonly used house heating fuel:
Utility gas (81%)Electricity (17%)Wood (1%)Bottled, tank, or LP gas (1%)
Monona compared to Iowa state average:
Unemployed percentage below state average. Black race population percentage significantly below state average. Hispanic race population percentage significantly below state average. Foreign-born population percentage significantly below state average. Number of college students below state average. There are 3 pilots and no other airmen in this city.


 Recent articles from our blog. Our writers, many of them Ph.D. graduates or candidates, create easy-to-read articles on a wide variety of topics.


 (52.0 miles